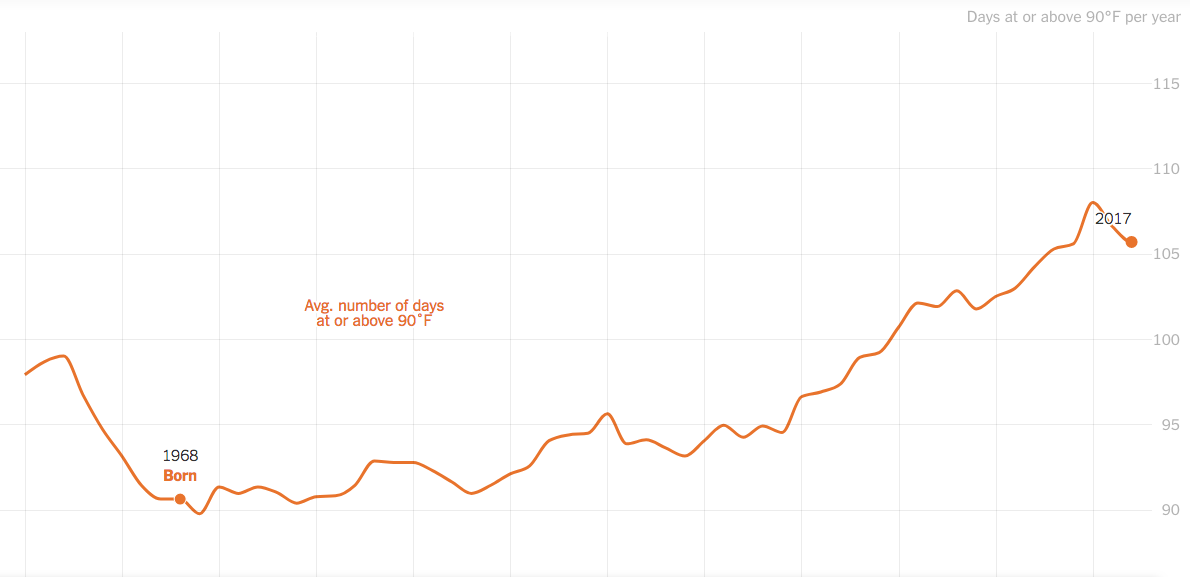
Every year, it seems we get more days where the temperature sails above 90 degrees. This New York Times app basically confirms it, mapping historical data from the Climate Impact Lab that goes back to 1960. Compared to thirty years ago, North Texas gets an average of another dozen days above 90 degrees every year. And it’s only getting hotter.
Last year, we charted above 90 on 106 days. In 1987, we got to 92. Come 2067 we’re looking at 129. The warming is moving faster, too. Between 1960 and 1987, the region added six more days, which is about half of the increase we’re seeing now. Our baseline is also getting much warmer. We’re basically Houston in 1987 at this point—the city to our south had 105 days above 90 in 1987 and is now looking at around 118.
You may remember the Climate Impact Lab from the study its researchers issued in 2017, which analyzed the county-to-county changes in temperatures across the country. It wasn’t kind to Dallas County, to which it attached lower income, higher energy expenditures, and a higher mortality rate as byproducts of climate change here.
Also of note is The Times’ phrasing: “As the world warms because of human-induced climate change, most of us can expect to see more days when temperatures hit 90 degrees Fahrenheit or higher.” Tropical regions, like Jakarta and New Delhi, are already staring at half-a-year of above-90 days. They’ll be facing up to at least eight months of it by the end of the century.
Play around with the tool here. It may make you want to move to San Diego, an area “not prone to 90-degree days.” And maybe it’s time to ask our local meteorologists their thoughts on climate change again.